Non Monetary Conversions - Conversion Rate
Guide for:

This report provides a graphical overview of the Conversion Rate trend during in the selected time period.
The Conversion Rate is the percentage of non-monetary conversions with respect to the total number of visits in the selected time period. In the first summary table, you can find the following data:
- Number of conversions
- Visits
- Conversion rate
Filters
- Calendar: this option allows you to select the time interval for which you want to analyse the traffic data. For more info, click here.
- Select a Non-Monetary Conversion: by using the drop-down menu you can filter the data for the Non-Monetary Conversion you want to analyze.
- Devices: this feature allows to sort the data in the underneath table by the selected option (All, Desktop, Mobile, Tablet or Smartphone)
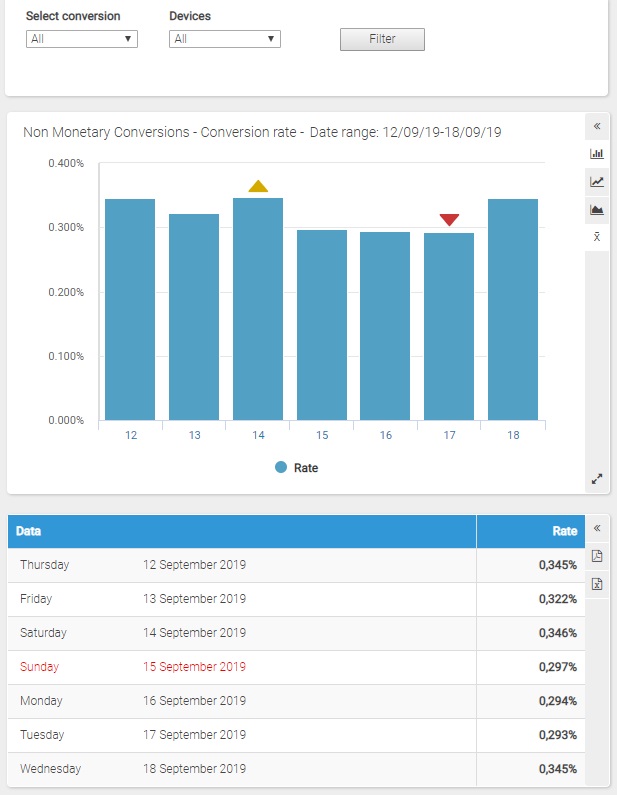
Chart
On the horizontal axis, the chart shows the days or the months of the represented period and, on the vertical axis, the conversion rate.
It is possible to choose a different graph chart by clicking on the icon corresponding to the graph type (FL means "Flash Chart").
For intervals no longer than 6 months the chart shows a dotted line representing the 7-day mobile average.
For the other intervals, the chart shows only the 7-day mobile average.
Table
Each line of the table shows the following information:
- Date: it shows the specific day or month in consideration
- Rate: it shows the non-monetary conversion rate for the specific time period
Click on the name of a month to view the daily data.