Non Monetary Conversion per Country
Guide for:


In this report ("Non Monetary Conversion per Country") the Non Monetary Conversions are aggregated based on the Country of origin of your visitors.
In particular, it shows the list of countries from which visitors connected when they completed non monetary conversions and the corresponding percentage on the total non monetary conversions.
Filtri
- Calendar: it allows you to select the time interval for which you want to analyse the traffic data. For more info, click here.
Charts
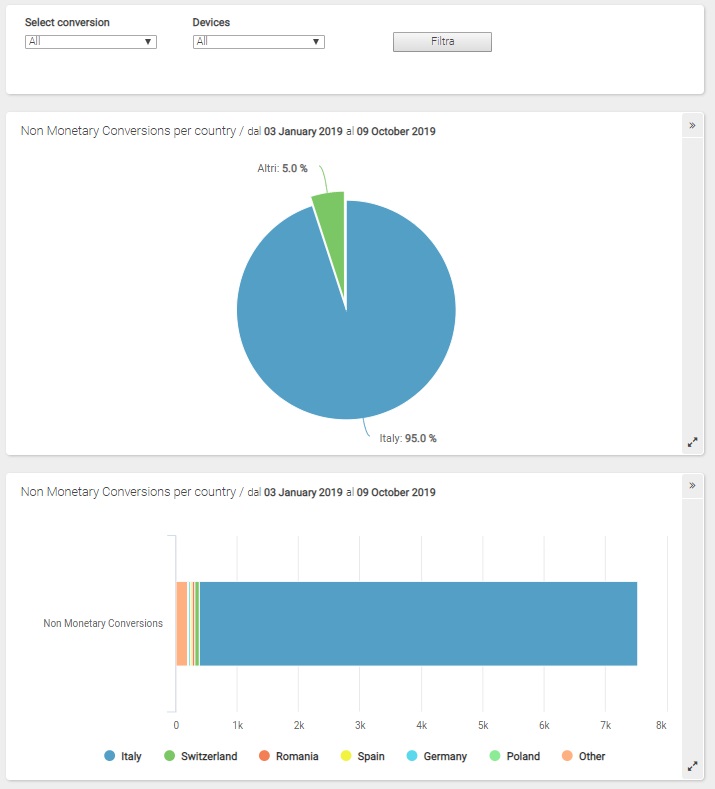
The pie chart shows the percentage composition of non monetary conversions according to the countries of origin.
The stacked bar chart shows the composition in absolute values of non monetary conversions according to the countries of origin (represented with different colors).
Table
In every line of the table you will find the following data:
- Country: the Country from which visitors connected when they completed non monetary conversions
- Conversions: the total number of non monetary conversions from the Country under examination in the selected time period
- %: the relative percentage on the total
- Conversion Rate: the percent of non monetary conversions coming from the Country under examination out of the total visits coming from the same Country.
 , you access the report that shows the distribution of non monetary conversions coming from the corresponding geographical area.
By clicking instead on the name of each country, the report shows the list of the cities (for the selected country) from which the non monetary conversions arrived in the period.
Only for Italy, by clicking on "Italy" you can view aggregated data by regions.
Furthermore, by clicking on the name of the single region, the report shows the list of cities belonging to the selected region from which the visits arrived in the selected period.