B2B module (Business to Business)
Guide for:


How can you gain real-time insight into traffic generated by companies connecting to your site? How can you tell if your site attracts business users? Which companies visit your site? How often do they come back? Do they stay with you or leave your site after viewing the home page?
Through the “last 300 visits” report, you can see the latest companies to visit your site, while by using the B2B module you can also separately analyse the traffic generated by business users.
In the “B2B Module” report, you can see in detail all of the companies which visit your site over a selected period of time.
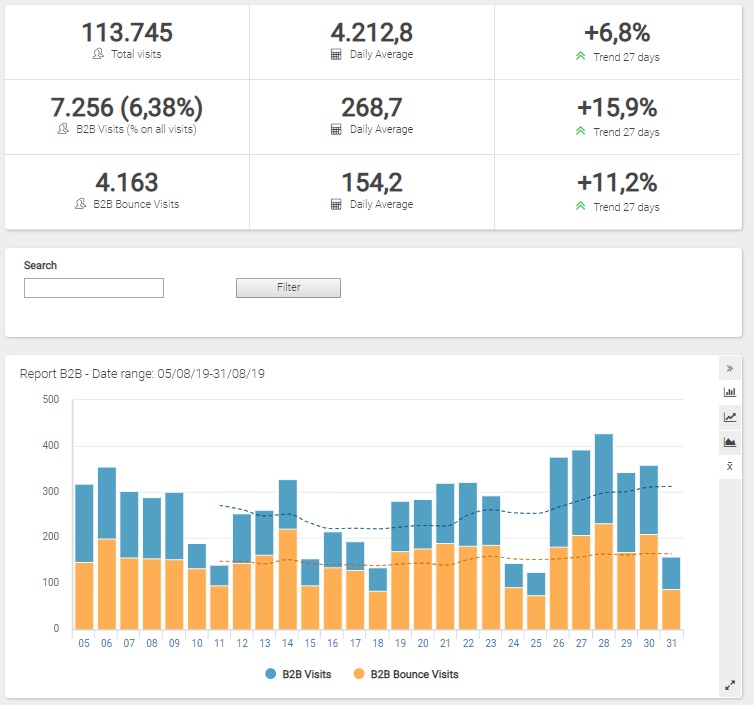
In the initial summary, the following information is shown for the selected period:
- Total Visits: total number of visits made by all the users
- B2B Visits: total number of visits made by companies
- Average Daily B2B Visits: Average number of visits by companies per day
- B2B Visit Trends (last 28 days): trend of visits by companies in the last 28 days
- B2B Bounce Rate: number of visits made by companies which look at one page of your site then leave
- Average Daily B2B Bounce Rate: average number of visits per day by companies that see one page of your site then leave
- B2B Bounce Rate Trends (last 28 days): trend of bounce visits by companies in the last 28 days
Trend indicates the flow of visits from companies in the period under consideration and, in particular, the change in percentage of visits in the second half of the period compared to the first half.
Filters
- Calendar: it allows you to select the time interval for which you want to analyse the traffic data. For more info, click here.
- Search: this option is very useful because it allows you to perform a search within a great number of pages as well as to analyse all the pages in a group. For example, you can retrieve the pages in a site directory and the total requests to them simply by entering the directory name.
The graph shows the days or months selected (on the horizontal axis) and the number of visits and bounce visits on the vertical axis. It is possible to change the graph type by clicking the corresponding icon (top right).
For periods up to 184 days, the graph is displayed with a dashed line as well as the moving average for 7 days. For periods longer than 184 days, only the moving average is displayed.
Table
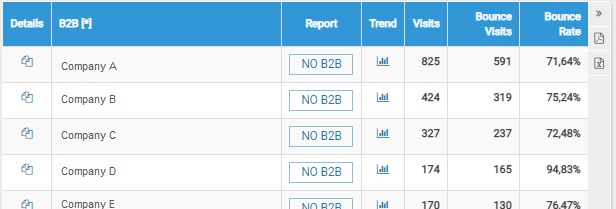
On each row of the table, the following information is shown for the selected period:
- Details: the “Details” icon allows you to view the report showing all details of visits made by the specific company
- B2B [*]: shows the name of any company which has visited the site. In particular, it shows the corporate entity to which an IP address has been assigned
[*] Attention! Information regarding the names of companies is provided by RIPE NCC. Any errors or discrepancies are due to this factor. Should you find any errors, please report them by clicking on the “NO B2B” button.
- Report: clicking the “NO B2B” button allows the user to report the name of an entity which is revealed to not be a genuine corporate organisation. The button is not to change the information, but only to send a report to ShinyStat Staff to carry out any necessary checks and modifications.
- Trend: clicking the “trend” icon for each company accesses the report showing the trend of visits made by that company
- Visits: shows the number of visits made by a company
- Bounce Visits: shows the number of visits by companies that leave after viewing only one page
- Bounce Rate Frequency: shows the percentage of visits made by the specific company which were concluded after seeing only one page – the frequency with which a company has entered the site, viewed only the front page and left. The bounce rate expresses the ratio between the number of times a company has viewed a single page before leaving (bounce visits) and the total number of visits made by the company in question (Visits)
Remember that access to this report will be password protected, even if you choose to make the results visible to third parties by deselecting the “password protected” option under “Setup > Preferences”.
N.B.
In the ShinyStat Pro version users will be able to display only the first page.