B2B Module > Details (Visits by individual companies)
Guide for:


How is it possible to analyse in detail the traffic generated by individual companies connecting to your site?
Beyond the primary report that provides an overview of visits made by business targets, ShinyStat also offers further details to analyse visits made by each company that visits your site.
Overview
In the initial summary, the following information is shown for the selected period:
- B2B Visits: total number of visits made by companies
- Average Daily B2B Visits: Average number of visits by companies per day
- B2B Visit Trends (last 28 days): trend of visits by companies in the last 28 days
- B2B Bounce Rate: number of visits made by companies which look at one page of your site then leave
- Average Daily B2B Bounce Rate: number of visits per day by companies that see one page of your site then leave
- B2B Bounce Rate Trends (last 28 days): trend of bounce visits by companies in the last 28 days
Filters
- Calendar: it allows you to select the time interval for which you want to analyse the traffic data. For more info, click here.
- Search: this option is very useful because it allows you to perform a search within a great number of pages as well as to analyse all the pages in a group. For example, you can retrieve the pages in a site directory and the total requests to them simply by entering the directory name.
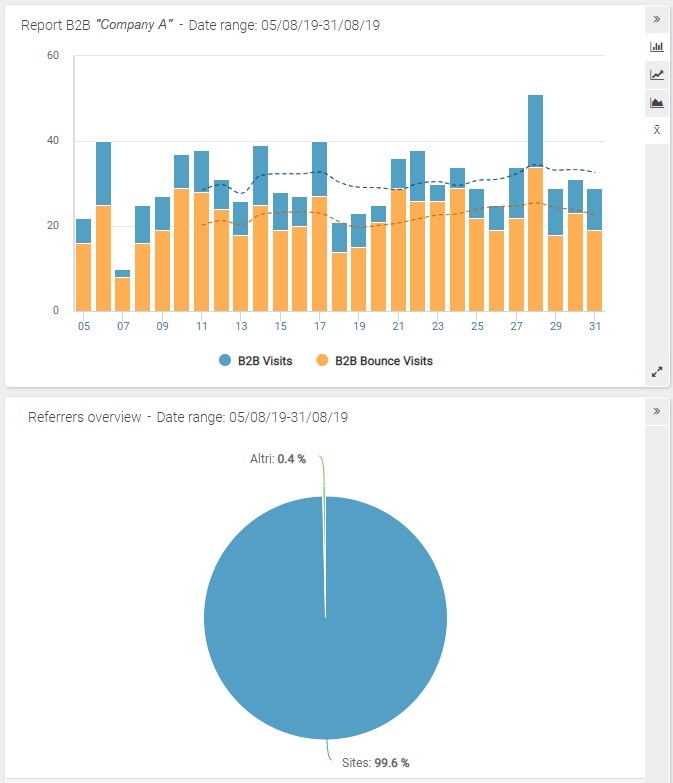
Graph – Trend of visits by companies
The graph shows the days or months selected on the horizontal axis and the number of visits and bounce visits (those concluded after seeing only the front page) on the vertical axis.
It is possible to change the type of graph by clicking on the corresponding button (top right).
For periods up to 184 days, the graph is displayed with a dashed line as well as the moving average for 7 days.
For periods lasting more than 184 days, only the moving average is displayed.
Chart - Total referrers (How companies found your site)
The pie chart shows the percentage distrubution of visits that each company has made to your site from various sources: search engines, pay per click, campaigns, blogs and social networks, direct requests.
Clicking on “Details” (bottom right) gives you access to reports detailing traffic information for each source: number of visits, data flow, percentage of total, trends, bounce visits, bounce rate.
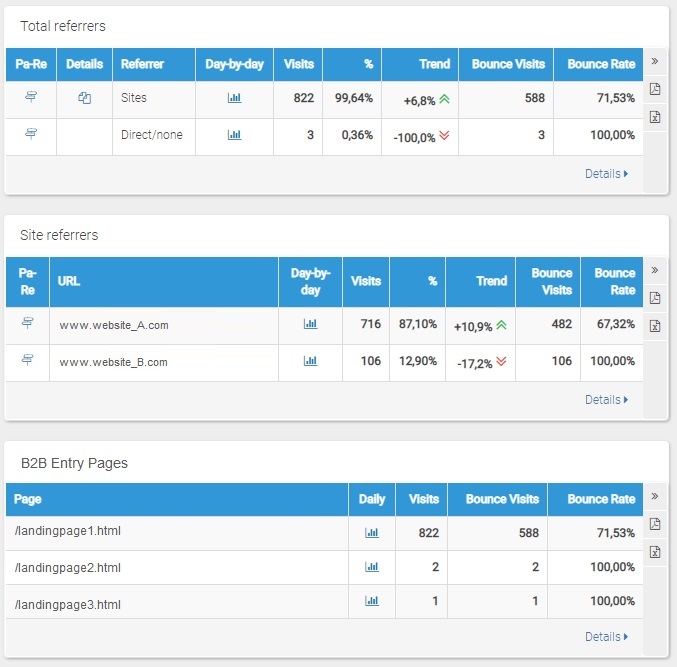
Tables – Referrers
The following tables show further details of the traffic sources shown in the pie chart in descending order. In particular, they show:
- Referral sites: a list of the various web pages that directed companies to your site, with details about each URL;
- Referral blogs and social networks: a list of blogs and social networks that directed companies to your site, with details of all visits.
- Keyword searches: a list of keywords used by companies to reach your site via search engines.
- Campaigns: percentage distribution of campaigns (configured by ShinyStat) which have directed companies to your site over the selcted period.
Clicking on “Details” (bottom right) gives you access to the detailed report, as well as a summary of the global data, shown as a pie chart and table with information on visits from each campaign.
- PPC referrals: percentage distribution of PPC Campaigns (Pay Per Click) that directed companies to your site over the selected period.
Clicking on “Details” (bottom right) gives access to the detailed report.
Referral page details
This report provides a list of pages that have referred a company to your site.
The bounce rate for each site is shown (the number of times a company has left your site after viewing only one page)

Graph - Geolocation (Cities where companies visiting your site are based)
The pie chart shows the percentage distribution of visits by companies depending on the geolocation and, in particular, the city where they are based.
Information regarding the city is taken from the IP address of the visitor.
Clicking on “Details” gives access to the report showing data related to each city of origin, providing the number of visits from each city and the percentage of total visits.
N.B.
In the ShinyStat Pro version only the first page is available.