Campaign referrers
Guide for:

How does one go about verifying how successful your online ad campaigns have been?
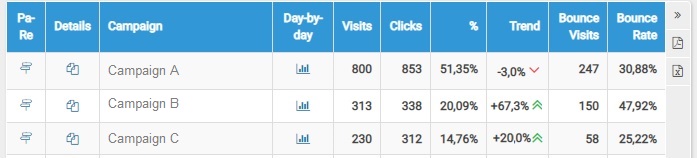
In the report "Campaign Referrers" you can see how many clicks and visits result from your online ad campaigns, properly set up using ShinyStat™ (see Campaigns from parameters and Campaigns from domains). The first table shows the number of Campaigns listed below and the number of related visits and clicks.
Filters
- Calendar: it allows you to select the time interval for which you want to analyse the traffic data. For more info, click here.
- Pay per Click: through this option you can filter the data for the selected type of Pay Per Click.
- Search: this option allows you to find the search keyword of your interest with extreme swiftness by entering in the field its full name or part of it.
Campaign day-by-day data export
This feature allows you to export campaign data in order to analyze its progress on a daily basis.
In particular, it is possible to select one or more metrics among those available (clicks, visits, rebound visits) for which you want to export day-by-day data.
By clicking on the option "Grouped by campaign", it is possible to obtain a csv file which shows for each campaign the list of selected metrics with the related data; so data is displayed campaign by campaign.
It is a useful export when you want to analyze the single campaign by comparing the various metrics, for example visits with clicks and / or with bounces.
By clicking on the "Grouped by metric" option, you can obtain a csv file that shows the list of campaigns (and related data) for each metric.
It is a useful export when you want to compare different campaigns to evaluate which have received more or less clicks, visits and / or bounces.
Table
In every row of the table you will find the following data:
- Campaign: the name given to the specific campaign in Settings
- Visits: the number of visits resulting from the specific campaign
- Clicks: the number of users' clicks on the ads for the specific campaign
- Percentage: the percentage of visits with respect to the total number of visits resulting from campaigns
- Trend: the trend compared with the previous period
- Bounces: the number of times when the landing page was the only page viewed during a visit, that is the number of visits by browsers coming from the campaign under examination, that entered the site, viewed a single page and exited the website
- Bounce rate: the percent of visits, coming from the campaign under examination, consisting of a single page view out of the total visits coming from this campaign
 you can access the report that shows the trend of clicks and visits resulting from the specific campaign in the selected time period.
 Bounce Rate The Bounce Rate, in connection with a traffic source, helps you in understanding the possible reactions of users when arriving on your site from a particular campaign (banner, mail, link, or Pay Per Click).
A high Bounce Rate could be due to a gap between the landing page and the expectations that an ad in the site or in a promotional campaign has generated in the user.
The Pages report (Pages) lets you see in detail which pages have a higher "Bounce Rate" for a specific source, providing you with a useful set of statistics to figure out what are the problems for your visitors and optimize your investment.
For more information about Bounces, please take a look at the page called: Bounces - Bounce Rate
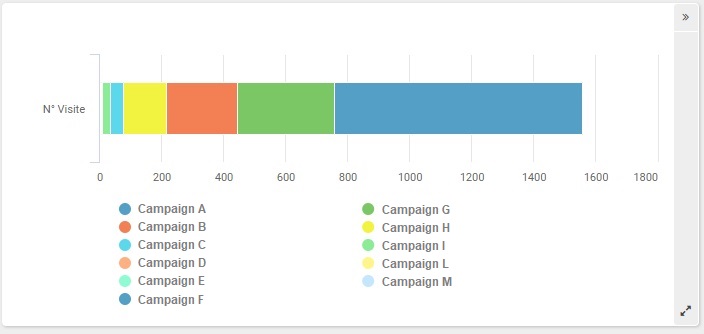
Chart
The stacked bar chart shows the composition in absolute values of visits coming from the active campaigns.
Watch Out! The system keeps track of the traffic resulting from a campaign if and only if:
- the campaign has been properly set up and activated in the selected time period
- the ShinyStat™ code has been properly inserted in the page that the link points to (landing page)
Campaigns
Traffic data from links configured as Google Analytics Campaign are displayed in the "Campaign Referers" report regardless of the traffic source in which the link was clicked (since 14th December 2017).
For further information, please contact the ShinyStat Support Centre
Attention! Bounces and Bounce Rate are available since July 2010.