Video analytics - Systems - Video play for Browsers
Guide for:


This report shows the most used browsers to see your videos.
In the report called “Browsers”, all video views to your videos are listed according to the Browsers used by your visitors.
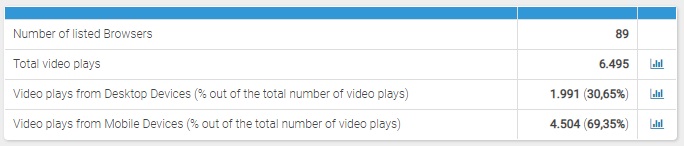 The first table provides the following information:
- Number of listed Browsers, that is the total number of browsers (and their versions) used to see your videos
- Total Video views
- Video views from Desktop Devices (% out of the total number of video views)
- Video views from Mobile Devices (% out of the total number of video views)
Filters
- Time period: by using the drop-down menu you can filter data for the time period you want to analyze.
- Advanced calendar: you can select specific time periods other than those available with the drop-down menu "time period", thereby choosing freely the time period to examine. For more info on using the Advanced calendar, click here.
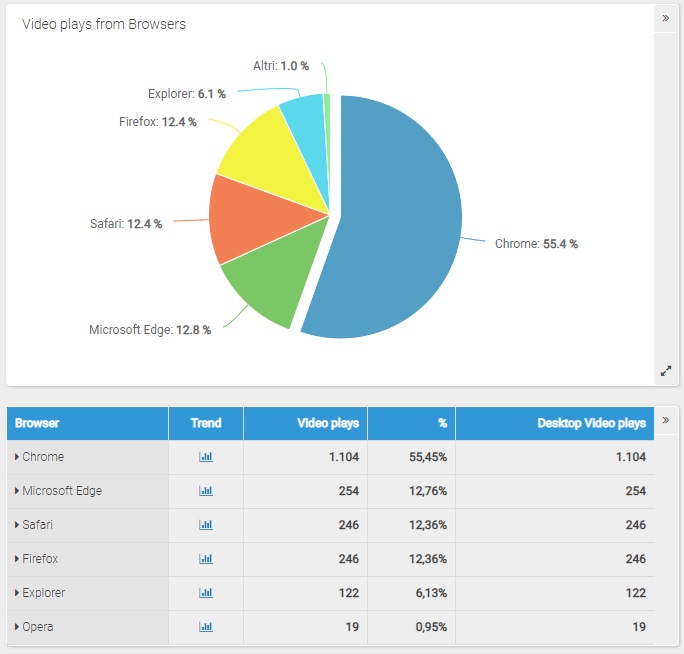
Chart
The pie chart shows the percentage distribution of all video views by different browsers in a particular time period.
Table
Each line of the table provides the following information:
- Browser: the name of the browser used to see your videos
- Video views: the total number of video views to your videos for a given browser.
- Percent (%): it shows the percent of video views to your videos for a given browser, out of the total number of video views
 in connection with each browser, you can access the report showing the trend of video views to your videos using the given browser in a particular time period.
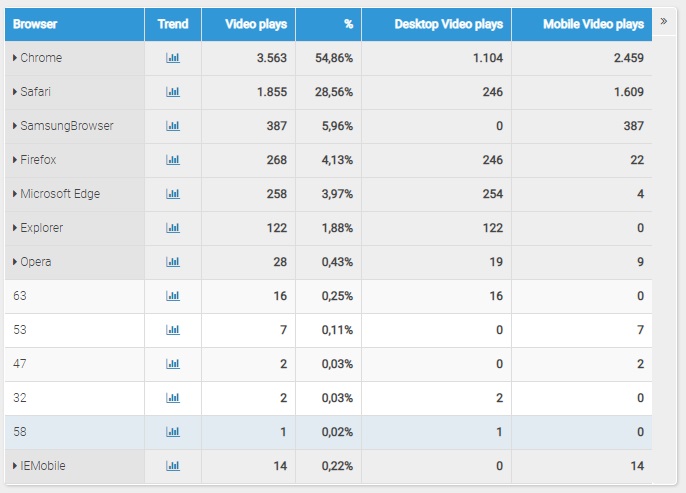
Browser Versions
To view all details related to the Browser versions, just click on the blue arrow by the name of the Browser that you want to analyze.
- Clicking on the Browser name, you can expand the table and see detailed data.
- Clicking once again on the expanded Browser name, you can close the table with Browser versions information.