Video analytics - Systems - Desktop vs Mobile
Guide for:


This report shows the video views to all the videos analyzed with your ShinyStat account during the selected time interval according to the device used by your visitors. In particular, the “Desktop vs Mobile” report allows you to compare the trend of video views by visitors utilising a desktop device to the trend of video views using a mobile device.
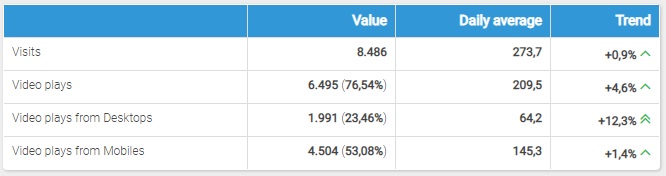
The first table provides the following information:
- Video views
- Daily average Video views
- Trend Video views
- Video views from Desktop Devices
- Daily average Video views from Desktop Devices
- Trend Video views from Desktop Devices
- Video views from Mobile Devices
- Daily average Video views from Mobile Devices
- Trend Video views from Mobile Devices
- Time period: by using the drop-down menu you can filter the data for the time period you want to analyze.
- Advanced calendar: you can select specific time periods other than those available with the drop-down menu "time period", thereby choosing freely the time period to examine. For more info on using the Advanced calendar, click here.
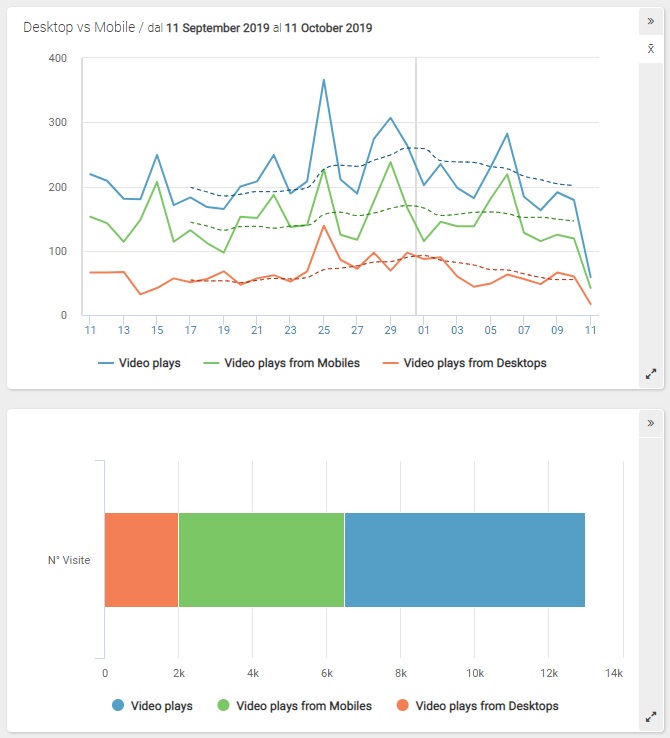 Chart
ChartOn the horizontal axis, the chart shows the days or the months of the represented period and, on the vertical axis, the number of video views, the number of video views from desktop devices and the number of video views from mobile devices.
It is possible to choose a different graph chart by clicking on the icon corresponding to the graph type (FL means "Flash Chart").
For intervals no longer than 6 months the chart shows a dotted line representing the 7-day mobile average. For the other intervals, the chart shows only the 7-day mobile average.
For interval no longer than 122 days, the real time data and the daily forecast for the current day are represented in different colors.
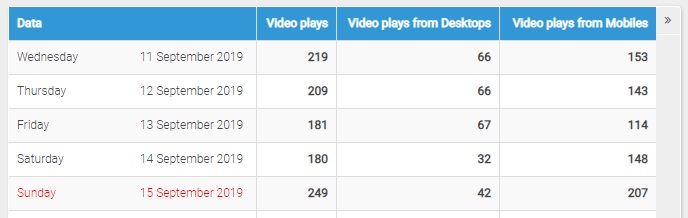
Table
Each line of the table shows the following information:
- Date: the specific day or month in consideration
- Video views: the total number of video views to your videos
- Video views from Desktop Devices: the total number of video views by visitors utilising a desktop device
- Video views from Mobile Devices: the total number of video views from a mobile device
For interval no longer than 122 days, the last two line of the table shows real time data and the daily forecast for the current day.