Monetary Conversions - Average Order Value
Guide for:

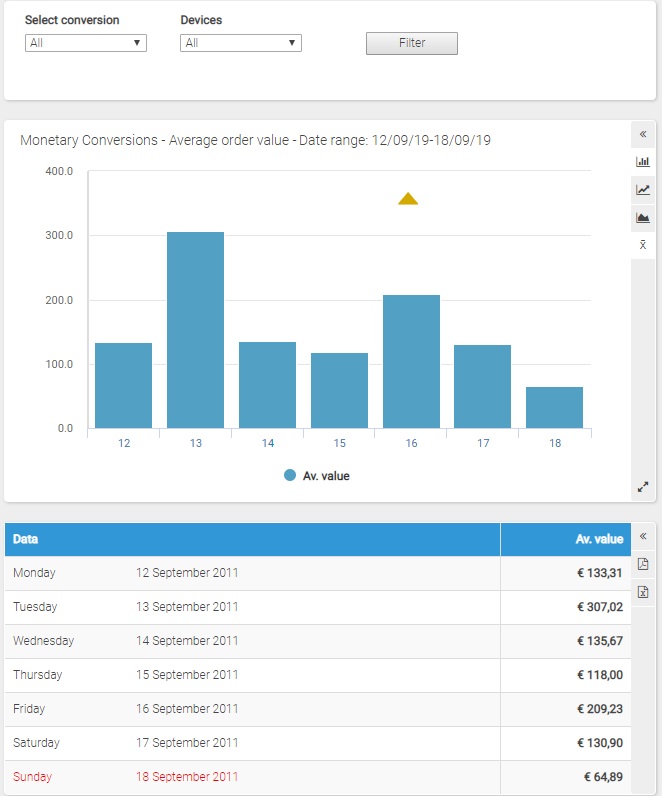
This report provides a graphical overview of the Average Order Value for the website in the selected time period. The Average order indicates the average revenue per orders; it is given by the total revenue divided by the number of total monetary conversions generated in the selected time period.
In the first summary table, you can find the following data:
- Number of conversions
- Total value
- Average order value
Filters
- Calendar: this option allows you to select the time interval for which you want to analyse the traffic data. For more info, click here.
- Select a Monetary Conversion: by using the drop-down menu you can filter the data for the Monetary Conversion you want to analyze.
- Devices: this feature allows to sort the data in the underneath table by the selected option (All, Desktop, Mobile, Tablet or Smartphone)
On the horizontal axis, the chart shows the days or the months of the represented period and, on the vertical axis, the Average order value generated by the website.
It is possible to change the type of graph by clicking on the icon on the right (bar, line and area graphs).
For periods that include at least 8 days, by clicking on the "Show/hide mobile average" icon, you can respectively show or hide the mobile average, displayed with a dotted line.
Table
Each line of the table shows the following information:
- Date: it shows the specific day or month in consideration
- Average value: it shows the revenue for the specific time period
Click on the name of a month to view the daily data.
Conversion List
The last table shows the complete list of all monetary conversions executed during the selected time period. For further information, please click on the following link: Monetary Conversions List