Systems - Cookies

The chart displays the percentage value of visits from browsers with Cookies enabled.
In the report entitled "Systems - Cookies" visits are classified according to browser settings between "cookies enabled" and "cookies not enabled".
Pie chart - Composition percentage
The pie chart shows the percentage composition of visits according to the Cookies settings, indicating the percentage of visits from browsers with Cookies enabled with respect to the percentage of visits from browsers with Cookies not enabled.
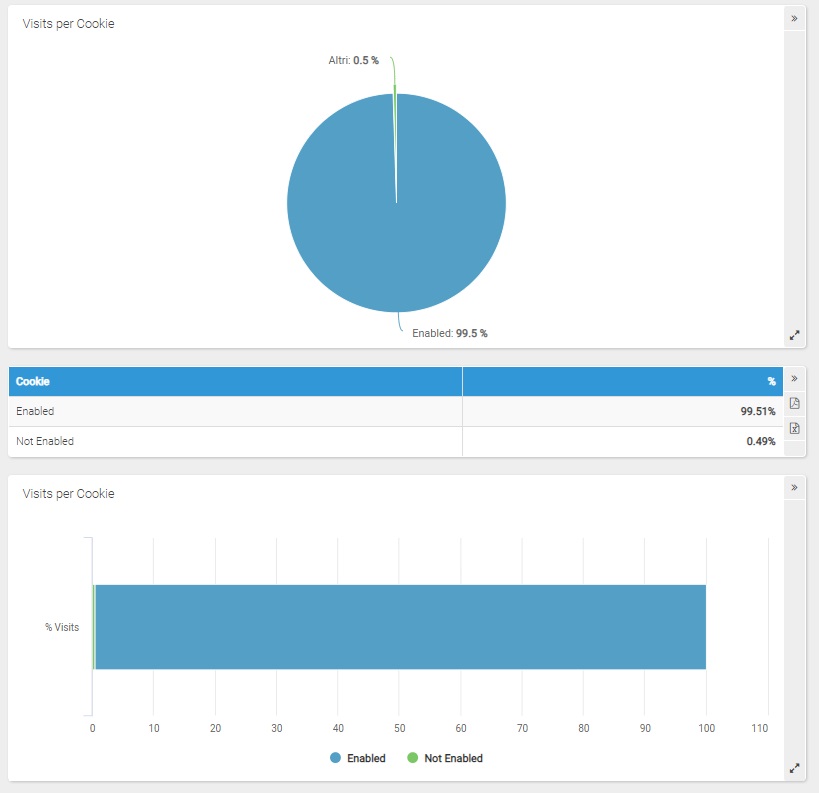
Table
The table indicates the percentage of visits from browsers with cookies enabled and the percentage of visits with cookies not enabled.
Stacked bar chart
The stacked bar chart shows the percentage composition of the visits received by the site with cookies enabled and with not enabled cookies (represented with different colors).