Paths
Guide for:

What are the most followed paths within the site?
Analyzing the customer journey improves the usability of the site and the sections where conversions are more frequent.
The Pages> Routes report shows the most popular paths on the site.
The term "path" indicates the sequence of pages viewed by a visitor during a session, up to a maximum of 6 page views.
The first table shows the number of significant paths, the number of the paths displayed in the chart and listed underneath and the average number of page views per visit.
Filters
- Select a period: it allows to filter data in order to display those relating to the month you wish to consider.
- Chart Size: the drop-down menu allows you to choose the size of the chart (Small, Normal, Large and Very large).
The number of displayed paths is proportional to the chosen size: by selecting the smaller size, the graph will show fewer paths. - Type of chart: the drop-down menu allows you to choose the type of chart: Sankey or Network.
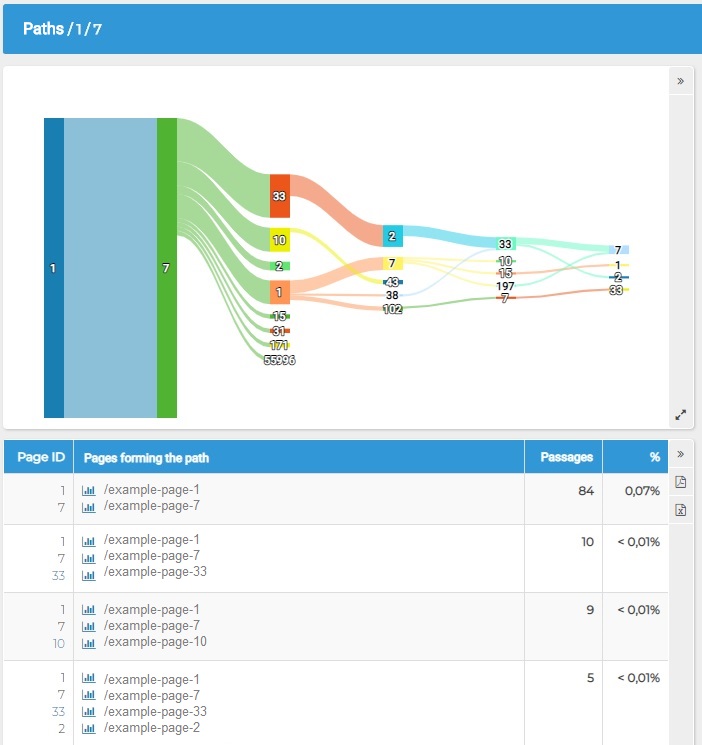
The Sankey diagram shows the paths followed in the site and highlights the transition from page to page. The width of the arrows is proportional to the amount of traffic; it allows to identify with a glance the paths most frequently followed.
The Network graph offers a more hierarchical and linear view: it immediately shows the relationship between the various pages.

Chart
The graphs provide a visual description of the visit paths. Each requested page is represented by a number.
The first number represents the entry page, while the following numbers indicate the pages viewed subsequently.
In general, each level shows the pages viewed starting from the previous ones, to which they are visually connected.
The flows and lines in fact represent the path from one page to another; their thickness indicates the frequency, ie the number of times that those pages have been viewd in that particular sequence.
By positioning the mouse on the page number, you can view its name. This option is available for the major browsers.
Table
The table shows a summary of all the data represented in the graphs:
- ID of each page
- Pages forming the path
- Passages, ie the number of times that the path under consideration has been followed
- Percentage with respect to the total number of passages measured on all paths.
The numbers that identify the various pages are not always the same, as they are reassigned monthly progressively, based on the succession with which each page is viewed by visitors.