Benchmarking

The report named "Benchmarking" allows you to measure and compare your site traffic to the traffic of a selected sample of sites that are using ShinyStat, on the basis of a series of parameters called 'performance indicators'.
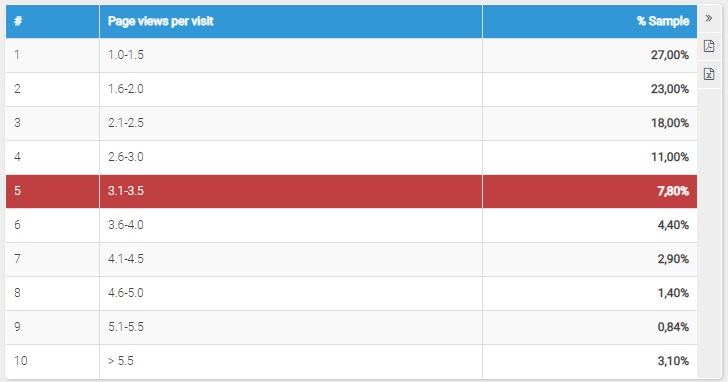
Table
For each indicator, the sample is divided into 10 classes whose reference values are listed in the table with the indication of the percentage of sites beloging to each class.
Chart
The chart represents the data in the table and highlights (indicating it in red) the performance class reached by your site according to the data totaled in the previous month.
The various performance classes are shown on the horizontal axis, while the percentage of sites belonging to each class is indicated on the vertical axis.
At the top right, the "Own value" is indicated, that is the value reached by your site for the selected Performance indicator.
Performance indicators
To choose one of the available parameters to measure your performance with, click on the 'Apply' button after choosing one of the following performance indicators from the drop down menu:
- Visits per month
- Page views per month
- New visitors per month
- Average time spent on site
- Average time spent per page
- Average page views per visit
- Percentage of direct requests
- Percentage of visits from search engines
- Percentage of visits from sites
- Percentage of visits from Italian sites
- Percentage of visits from foreign sites
Category Benchmarking
You can narrow the benchmarking search to the category to which your site belongs to.
The 'Category Benchmarking' option is available for the following categories:
- Culture& Society
- Industry & Handicraft
- Entertainment
- Medicine & Health
- Politics & Institutions
- Science & Technology
- Services
- Sport
To generate a report, choose the option 'Own category' instead of 'All the categories' from the available drop down menu.