Mobile Analytics - Bounce visits
Guide for:


This report shows the bounce visits to your site during the selected time interval according to the device used by your visitors.
The first table provides the following information:
- Bounce Visits from Mobiles
- Bounce Visits from Tablets
- Bounce Visits from Smartphones
- Bounce Visits (independently from the device)
- Bounce Visits
- Bounce rate (%): it shows the percent of bounce visits over visits
Filters
- Calendar: it allows you to select the time interval for which you want to analyse the traffic data. For more info, click here.
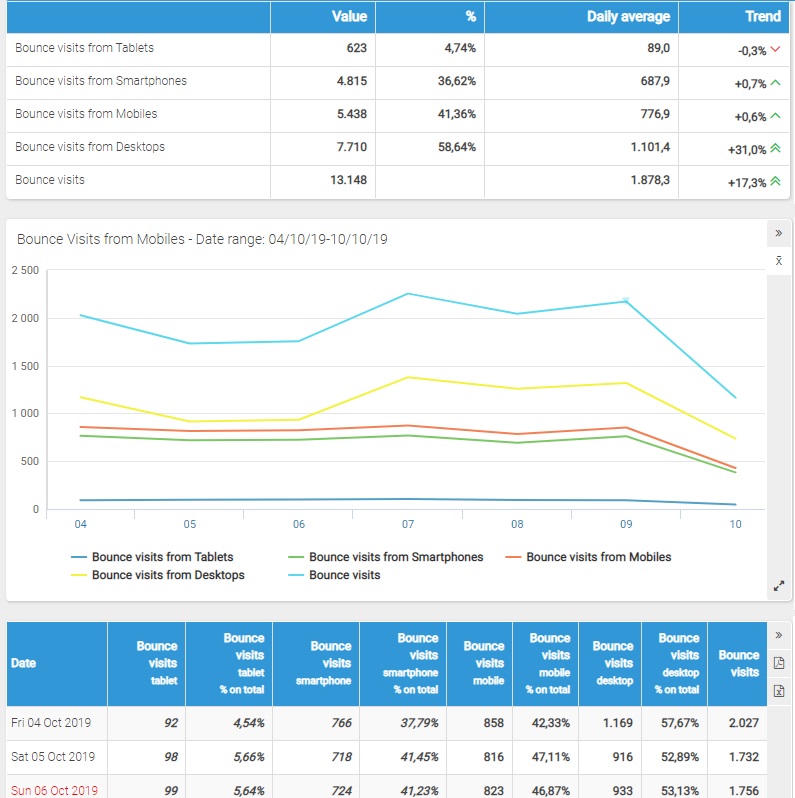
Chart
On the horizontal axis, the chart shows the days or the months of the represented period and, on the vertical axis, the number of bounce visits, the number of bounce visits from mobile devices, the number of bounce visits from tablets and the number of bounce visits from smartphones.
It is possible to choose a different graph chart by clicking on the icon corresponding to the graph type (FL means "Flash Chart").
For intervals no longer than 6 months the chart shows a dotted line representing the 7-day mobile average.
For the other intervals, the chart shows only the 7-day mobile average.
Selecting a period that includes today and no longer than 122 days, the real time data and the daily forecast for the current day are represented in different colors.
Table:
Each line of the table shows the following information:
- Date: it shows the specific day or month in consideration
- Bounce Visits from Mobile Devices: it shows the total number of visits using a mobile device
- Bounce rate from Mobile Devices (% out of the total): it shows the percent of Bounce Visits from mobile devices out of the Visits from mobile devices
- Bounce Visits from Tablet: it shows the number of Bounce Visits by visitors utilising a tablet
- Bounce rate from Tablet (% out of the total): it shows the percent of Bounce Visits from tablets out of the Visits from tablets
- Bounce rate from Smartphone: it shows the number of Bounce Visits by visitors utilising a smartphone
- Bounce Visits from Smartphone (% out of the total): it shows the percent of Bounce Visits from smartphones out of the Visits from smartphones
- Bounce Visits: it shows the total number of Bounce Visits to your site independently from the device
Selecting a period that includes today and no longer than 122 days, the last two lines of the table show real time data and the daily forecast for the current day.
N.B.
* Data on bounce visits from mobile devices is available since March, 1st 2018.