ShinyStat™ Debug - Misc - Detailed information on the chosen message
Guide for:

The detailed report offers useful information to understand the context in which the error occurred and the classes of systems on which it is present.
The "Debug - Details on the selected message" report shows the information collected about the received signals with the same error message.
It can be reached by clicking on the "magnifier" icon  available in the report "Misc" for each individual item.
The available filters allow an intelligent grouping of errors useful for identifying problems at a glance so as to solve them even before they have any impact on web browsing.
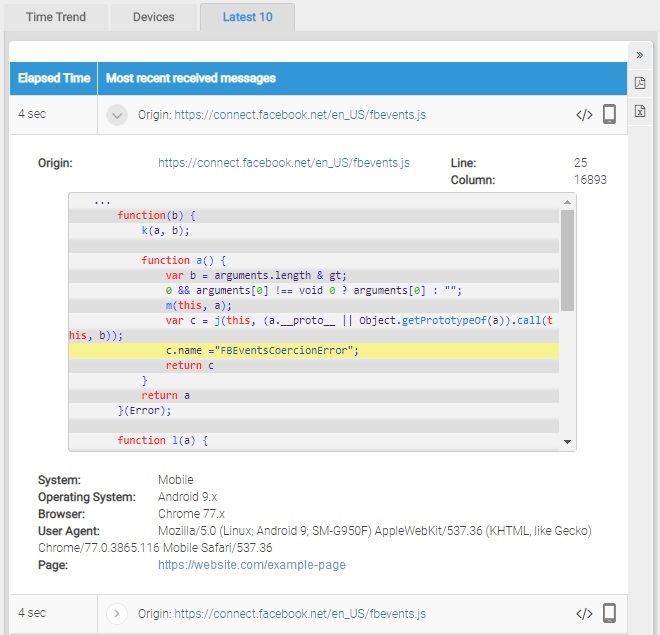
The report consists of three sections, in which you can view:
- the time trend
- details about the device
- the list of most recently received signals for this message
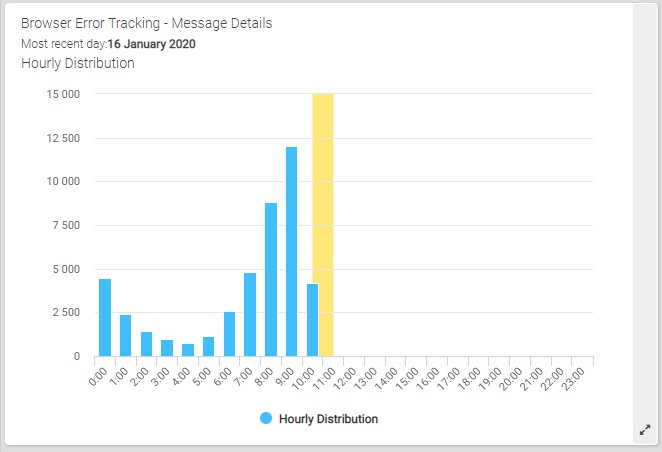
The "Time Trend" section shows the volumes received distributed over the time (over the different days) and the hourly distribution for the most recent day of the selected interval.
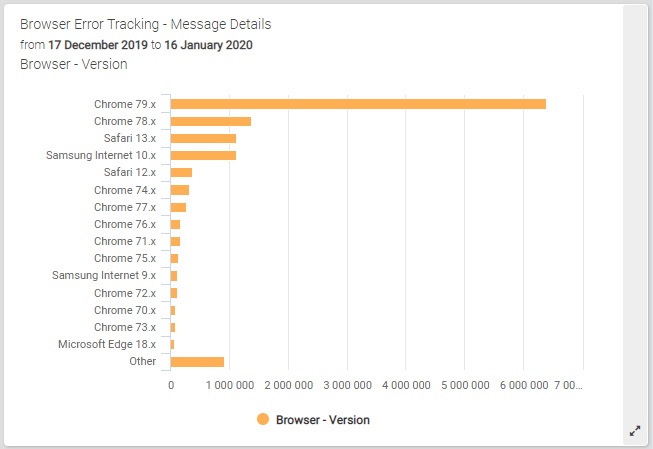
The "Device" section shows the distribution of volumes based on:
- type of device (desktop, mobile, bot, console...)
- operating system and version
- browser and version